
In the past several years, search engine optimization (SEO) has changed a lot. One of the more important factors that Google now considers are your website's Core Web Vitals, which include metrics like page speed and performance. The truth is, these metrics matter to users too, so whether you’re a web developer, marketing expert, or just a small website owner, it’s important to understand them.
One of these Core Web Vitals is LCP or ‘Largest Contentful Paint.’ It’s one of the metrics that Google uses to determine how fast your website loads, which may positively or negatively impact search engine rankings.
Simply put, all else equal, a faster website will typically be rewarded with better rankings in search results than a slower one. Higher search rankings mean more traffic, better quality traffic, and ultimately more revenue for your business.
So, whether you’re in marketing or web application development, having a firm grasp on fundamentals like LCP will help you improve search performance, user experience metrics, and often conversion rate too. In this article, you’ll learn what LCP is, how to measure it, and how you can debug potential issues and maximize performance for usability and search engine presence.
Understanding LCP
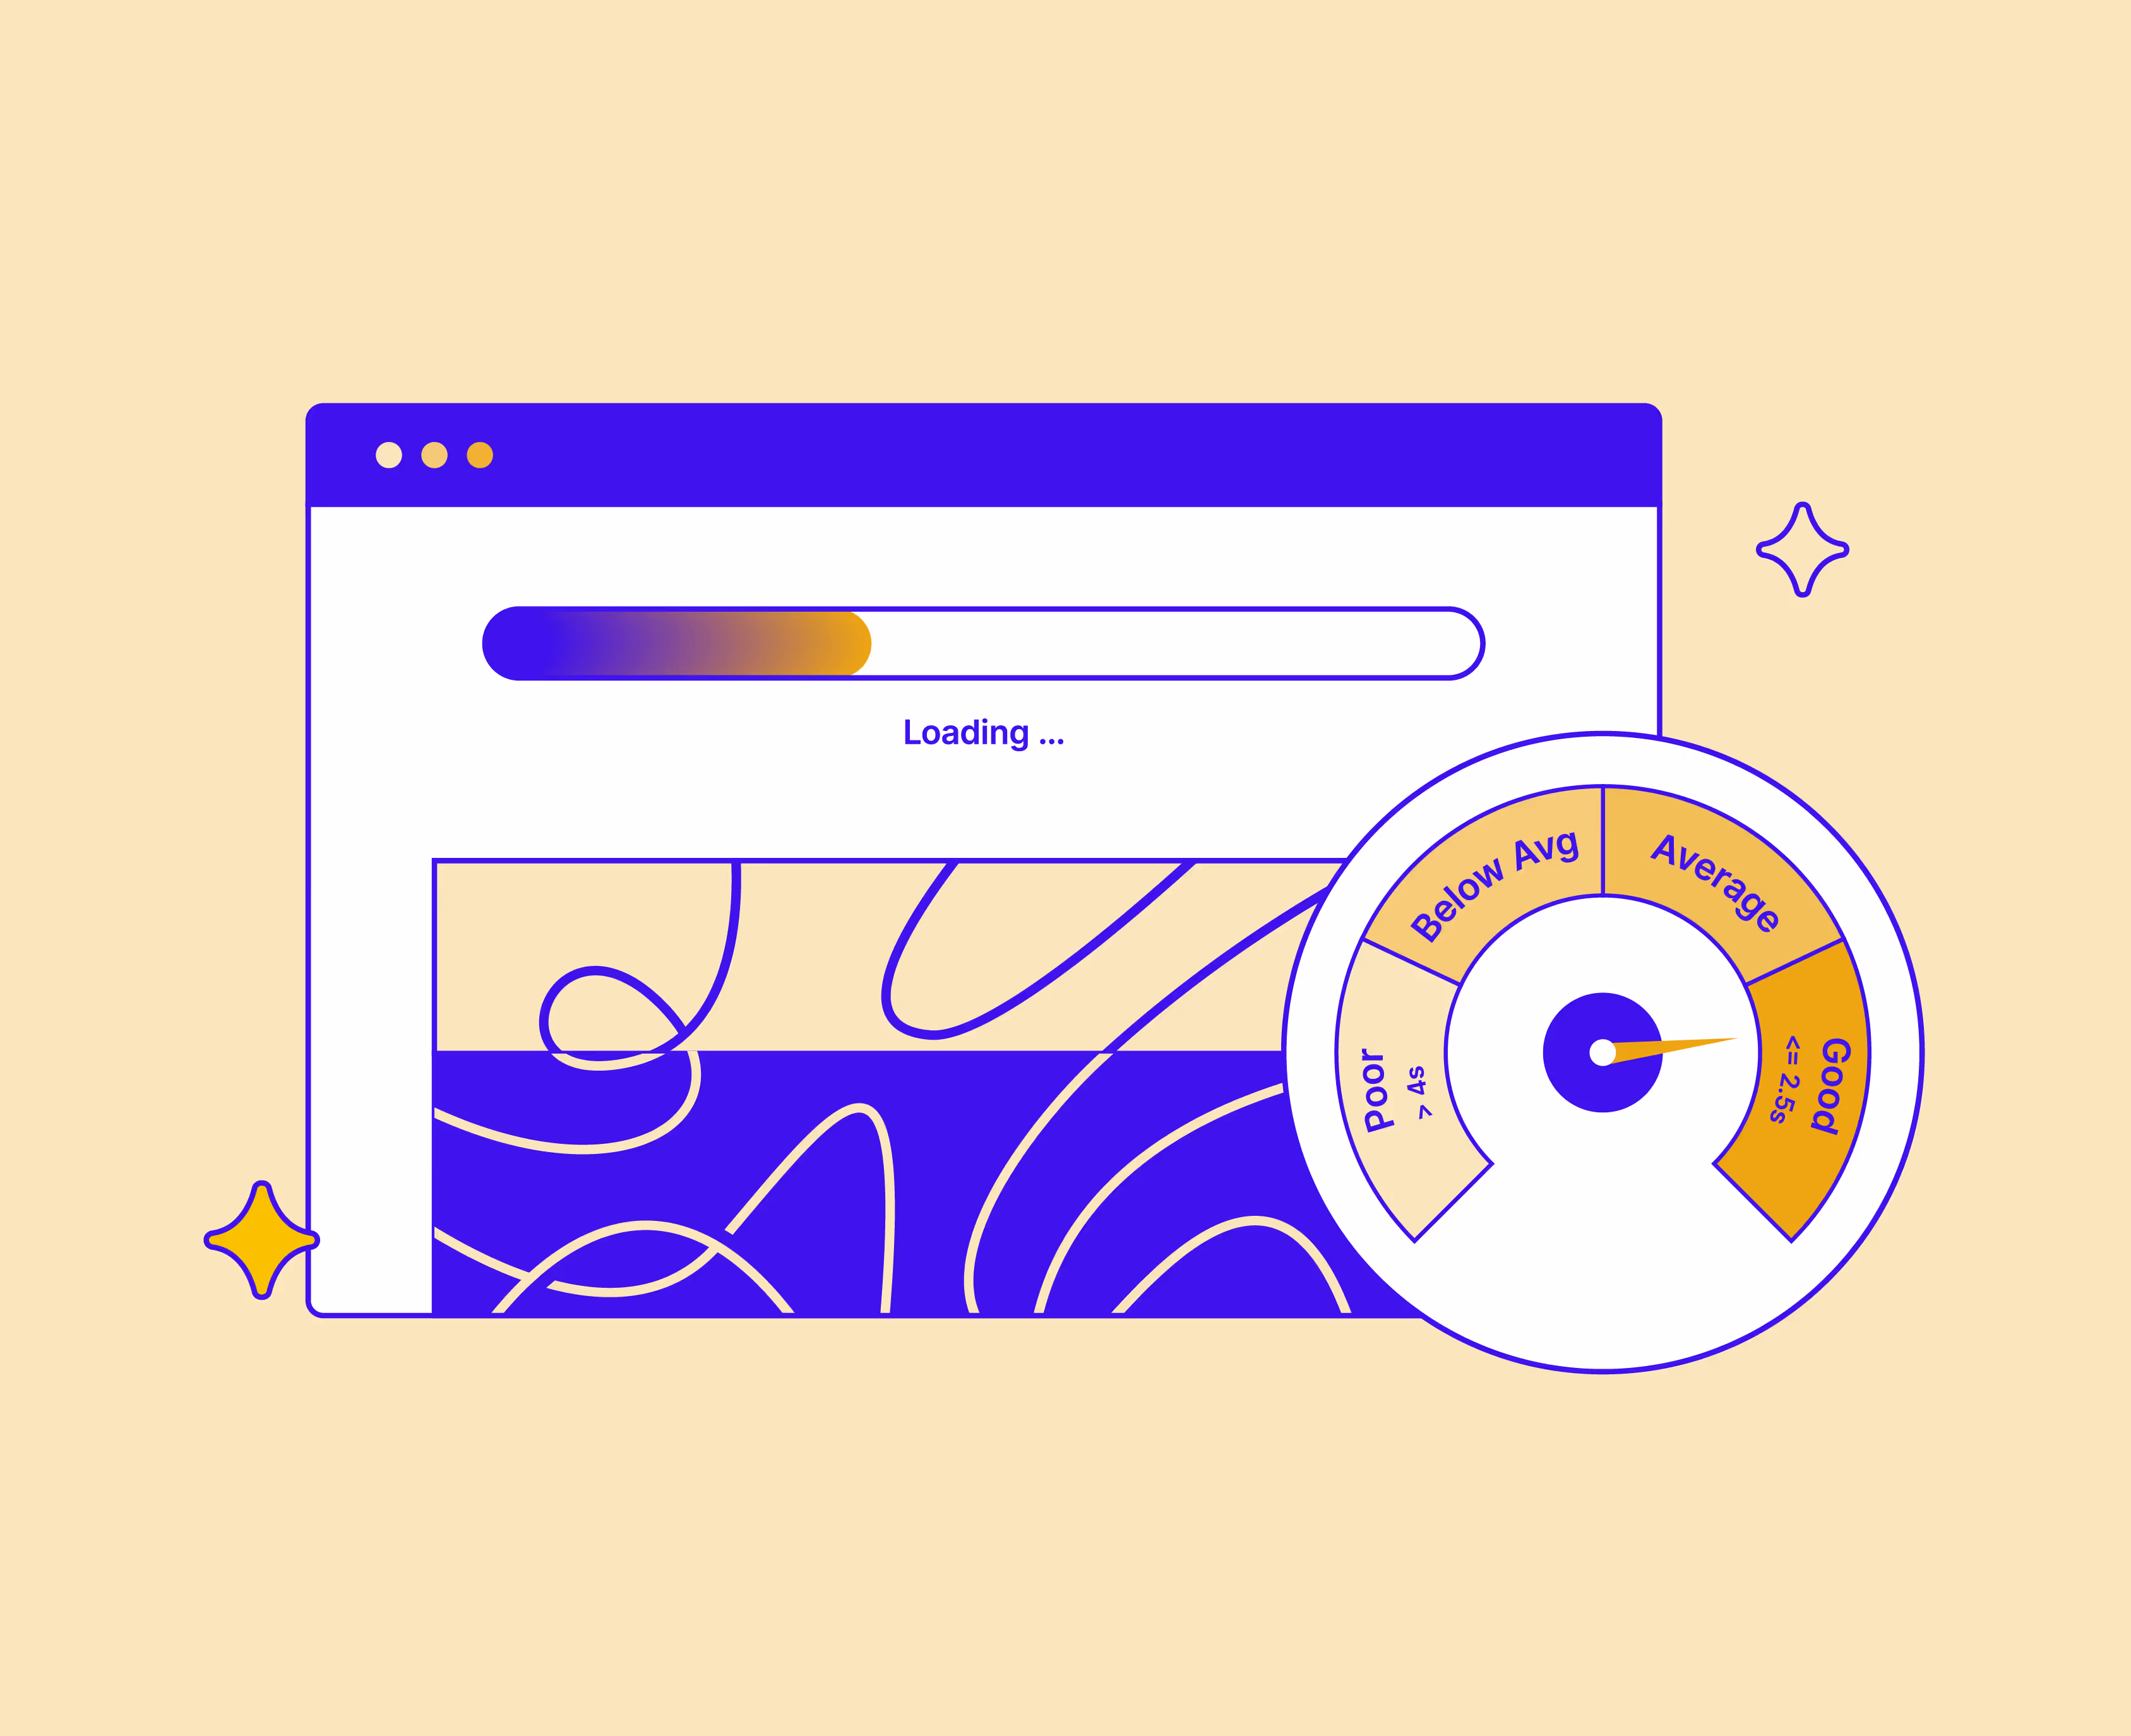
LCP or ‘Largest Contentful Paint’ refers to the metric used to measure how long it takes for the largest element on a web page to become visible and ready for users to interact with. It is typically expressed in seconds or milliseconds. Google recommends an LCP of <2.5 seconds for 75% of all page loads. Anything above 4 seconds is considered “poor”.
To understand how it works in practice, it’s important to understand what happens when a typical website loads. When a user visits a web page, the browser retrieves and renders various resources like images, videos, text, and other elements that make up the web page.
LCP measures the time it takes for the largest (in terms of dimensions) of these elements, such as a _hero image_ or a block of text, to finish loading and be visible within the user's viewport. Anything below the fold has no impact on the LCP. In other words: everything that requires scrolling to be displayed does not impact the LCP.
The LCP is closely related to two other metrics:
- First Paint (FP): This time it takes for the browser to render any pixel on the screen. In other words, it indicates when the browser starts to render any content, including background colors or unstyled text.
- First Contentful Paint (FCP): This time it takes for the browser to render the first complete piece of DOM content, such as text, an image, or a non-white canvas element.
Since the LCP uses the largest element within the viewport – as an estimation of the most important element – it is superior to both FP and FCP. It is also harder to game.
Measuring LCP
There are several ways to measure LCP, and they will probably not all return identical results, since LCP can be influenced by factors like network conditions, device capabilities, and user behavior. Therefore, it's typically best to measure LCP in multiple scenarios and over time to gather a more accurate understanding of your website's performance.
Web Page Testing Tools
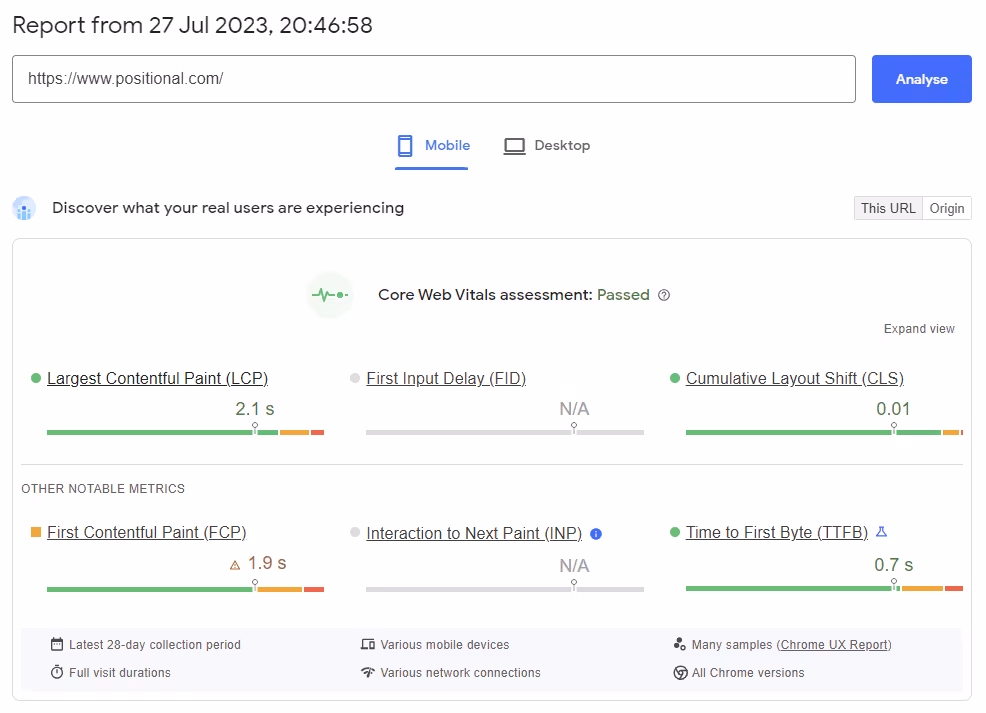
There are various (mostly browser-based) tools available that provide LCP measurement as part of their performance analysis metrics. Google Search Console, Google PageSpeed Insights including the API, WebPageTest, and GTmetrix all provide LCP metrics in addition to other performance-related data. Simply enter your website's URL into these tools, and they will generate a detailed performance report.
Google PageSpeed Insights is probably the most commonly used, and includes Lighthouse, an open-source tool for analyzing and improving web page performance. It can be run against any web page to audit performance, accessibility, progressive web apps, SEO, and more.
Browser Tools
Most modern web browsers, such as Chrome, Firefox, and Safari, offer built-in developer tools that include performance analysis capabilities. Access these tools by right-clicking on a web page and selecting "Inspect" or using keyboard shortcuts like F12 or Ctrl+Shift+I. Within the developer tools, you'll typically find a "Performance" tab that allows you to record and analyze the page's loading performance, including LCP. Chromium)-based browsers (like Chrome, Vivaldi, and Edge all have Lighthouse included.
JavaScript Performance APIs
LCP can also be measured programmatically through the Web Performance APIs. They provide a programmatic way to measure and capture performance metrics, including LCP, from within your JavaScript code. You can use the PerformanceObserver API to listen for the "largest-contentful-paint" entry type and capture the relevant timing data. This method requires some coding implementation but gives you more flexibility in integrating LCP measurements within your own scripts.
Identifying and Fixing Issues with LCP
Many tools that audit website performance come with a set of diagnostics and recommendations for each audit. For example, Lighthouse uses a set of five metrics: Largest Contentful Paint, First Contentful Paint, Total Blocking Time, Cumulative Layout Shift and Speed index for giving a holistic overview of a website’s performance. For each of these metrics, a list of diagnostics is shown.
Let’s break down three of the most common issues that contribute to poor LCP and how you can address them:
1. Inefficient Resource Loading
When a user from the other side of the globe visits your website, there’s a good chance that your website’s loading time will be longer than for a user that is located in the same country as your servers. This can cause long delays as web responses must travel the globe to reach users.
Server load times can also be affected by the amount of server-side action required for each request. For example, if loading a page requires several complex database queries, the server will take longer to respond than if the request only requires a cached response.
Sometimes the loading time of the largest element is the problem. For example, large images that are not compressed or sized properly will take longer to travel across the internet, leading to a worse LCP.
If you’re running into resource loading time or efficiency issues, consider the following tactics:
- Improve the initial response time of the main document, because all other requests depend on it.
- Reduce the distance resources have to travel by using a CDN.
- Reduce the size of the largest element by properly sizing it, using modern image formats, compressing them, or by switching out the font to a lighter-weight option (when the largest element is a block of text).
- Prevent clogging the network by explicitly prioritizing the largest element.
- Minimize network time by caching any static elements, especially the largest element in either a server or locally.
2. Delayed Resource Loading
Sometimes it’s not the loading which takes a long time, but rather the browser takes a long time to encounter the relevant element. This happens when the largest element is referred to very late in the DOM or when other elements are explicitly given a higher priority. This also happens when the largest element is set to load lazily or when it is dynamically added via a JavaScript code snippet.
If you’re experiencing issues with delayed resource loading, be sure to address the following:
- Prevent the largest element from being loaded dynamically via JavaScript.
- Ensure the largest element is not set to load lazily.
- Ensure that when the largest element requires a CSS background (image) or web font (text), it is set to preload.
- Explicitly set the fetch priority to ‘high’.
3. Render-blocking Resources
Several of a website’s resources such as cascading style sheets (CSS) and (synchronous) JavaScript files can effectively block the loading of the largest element. As the browser parses the HTML code that defines the DOM, it also processes any JavaScript or CSS it encounters. When these resources are placed in the <head> of your website, they prevent other elements from loading quicklier.
Fortunately, it’s relatively easy to address this issue by taking the following into account:
- Split up JavaScript and CSS files so that only essential portions are loaded before the largest element is shown. CSS/JS with a lower priority can then be loaded after. Many content management systems offerp plugins that can optimize CSS and Javascript. E.g. WP Super Minify for Wordpress.
- Ensure that the largest element is not added to the DOM via JavaScript, long after it has already been transferred over the network.
- Ensure that the element is not hidden by JavaScript code (this often happens when setting up A/B tests).
- Ensure that no complex code monopolizes the main thread, making a page unresponsive (these are known as ‘long tasks’).
Final Thoughts
In this article, you learned about the role of LCP in website and search optimization. You saw why it is an important page performance metric, and why it impacts user experience and search engine rankings.
Optimizing your website’s LCP is a necessary part of SEO, and as you’ve seen, there are several straightforward ways to understand and address any LCP issues. And by improving LCP, you can often have a positive impact on user experience metrics and conversion rates.
If you’re looking for more tools to help you improve your SEO, check out Positional. We’re building a toolset for content and SEO teams to help them with content optimization, technical SEO, and keyword strategy.