PageSpeed Insights API | Build A Performance Monitoring Tool

The PageSpeed Insights API is a valuable tool that measures your web page's performance and identifies areas for improvement. In this tutorial, you'll learn how to implement your own performance monitoring tool with the PageSpeed Insights API.

June 20, 2023
Written by
Milap Neupane
Reviewed by
Nate Matherson

Join 1,850+ SEO and marketing professionals staying up-to-date with Positional's weekly newsletter.

Subscribe

* indicates required

The PageSpeed Insights API is a valuable tool that measures your web page's performance and identifies areas for improvement. The API uses lab data from Lighthouse and real-world data from the Chrome User Experience Report (CrUX) to make recommendations for your web page. It provides insights on best practices, accessibility, performance, progressive web app optimization, and search engine optimization (SEO) enhancements like Largest Contentful Paint (LCP) and Cumulative Layout Shift (CLS).

The PageSpeed Insights API can measure performance on both desktop and mobile devices. You can create custom reports and integrations with other user-experience measurement tools. Additionally, the API allows you to focus on the metrics that matter to you.

In this article, you'll learn how to implement your own performance monitoring tool with the PageSpeed Insights API.

Getting Started with the PageSpeed Insights API

To get started with the PageSpeed Insights API, you can simply run the following curl command, specifying the website you want to analyze in the url parameter:


curl "https://www.googleapis.com/pagespeedonline/v5/runPagespeed?url=https://www.positional.com/"

This will return a JSON response that includes the page's loading experience and Lighthouse results. This can help you analyze the performance of the website. A sample response from the API looks like this:


{
    "captchaResult": "CAPTCHA_NOT_NEEDED",
    "kind": "pagespeedonline#result",
    "id": "https://www.positional.com/",
    "loadingExperience": {
      ...
    },
    "originLoadingExperience": {
      ...
    },
    "lighthouseResult": {
        "requestedUrl": "https://www.positional.com/",
        "finalUrl": "https://www.positional.com/",
      ...
      "runWarnings": [],
        "configSettings": {
            "emulatedFormFactor": "desktop",
            "formFactor": "desktop",
            "locale": "en-US",
            "onlyCategories": [
                "performance"
            ],
            "channel": "lr"
        },
        "audits": {
            "uses-rel-preload": {
         ...
            },
            "largest-contentful-paint-element": {
          ...
            },
            "bootup-time": {
         ...
            },
            "dom-size": {
          ...
            },
            "font-display": {
          ...
            },
        ...
        "timing-budget": {
                "id": "timing-budget",
                "title": "Timing budget",
                "description": "Set a timing budget to help you keep an eye on the performance of your site. Performant sites load fast and respond to user input events quickly. [Learn more about performance budgets](https://developers.google.com/web/tools/lighthouse/audits/budgets).",
                "score": null,
                "scoreDisplayMode": "notApplicable"
            },
        }
    },
    "analysisUTCTimestamp": "2023-04-24T18:18:15.204Z"
}

You can also use the APIs Explorer to try out the API without having to write any code.

Using the API Key to Make a Request to the PageSpeed Insights API

While you can make requests to the API without an API key, it's recommended that you create a free key to take full advantage of the API's features. Without an API key, requests are subject to rate limiting, and you won't be able to make multiple requests per second. If you make too many requests within a certain period of time, the API may temporarily block further requests or return errors. The documentation does not specify the exact figure for rate limiting without an API key. However, it's advised that you get an API key if you want to automate PageSpeed Insights.

With an API key, you're allowed a daily limit of 25,000 queries a day or 400 queries per 100 seconds.

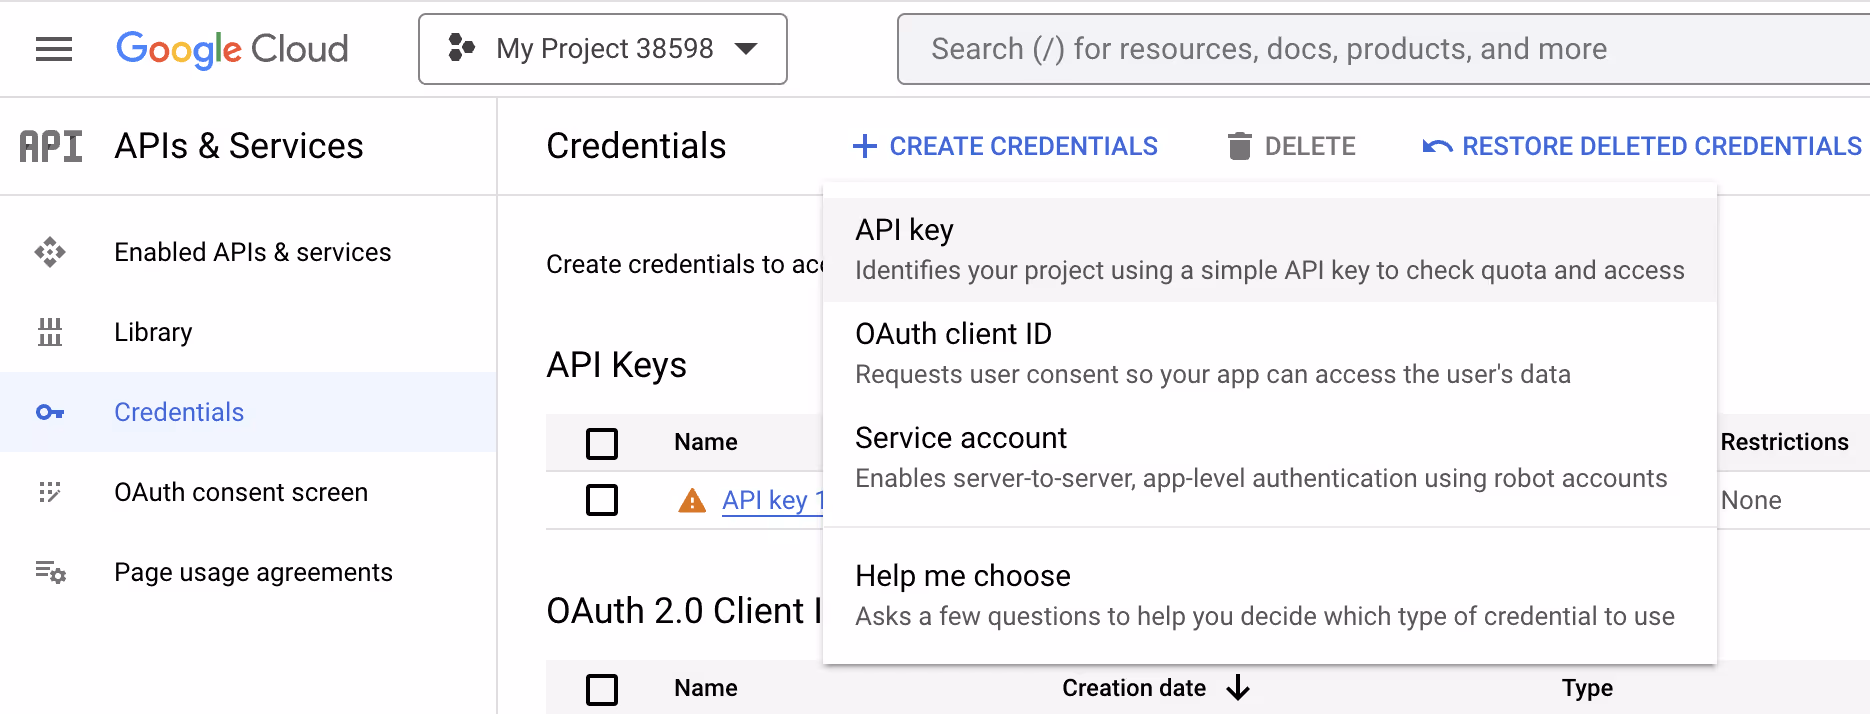
You can create a new API key for PageSpeed using the credentials management page.

Click + CREATE CREDENTIALS > API key to generate a new API key:

Create credentials

To use the API key, you just need to append &key=yourAPIKey to the curl command used above:


    curl "https://www.googleapis.com/pagespeedonline/v5/runPagespeed?url=https://www.positional.com&key=yourAPIKey"

Now that you have the API key, you can use it to make an API request while building the internal tool in the tutorial.

Implementing Your Own Performance Monitoring Tool with the PageSpeed Insights API

The remainder of the tutorial is dedicated to building a simple internal tool for conducting web audits using the PageSpeed Insights API and JavaScript.

To complete the tutorial, you'll need a basic understanding of JavaScript and access to the PageSpeed API key. You'll use Milligram as the frontend framework to add some design elements. This does not require you to install anything.

Setting Up a Project for the Internal Tool

Create a directory for the internal tool with the following command:


mkdir pagespeed-insight-api-demo-tool
cd pagespeed-insight-api-demo-tool

Creating an Interface to Display the API

The PageSpeed Insights API can be used with vanilla JavaScript using the Fetch API. Create an index.html file with the following HTML code:


<html>
    <body>
        <div class="container" id="main">
            <h1>PageSpeed Insights API Demo</h1>
            <form onsubmit="return getPageSpeedInsights()">
                <div>
                <label>Enter URL to Test Page Speed:</label>
                <input id="url" name="url" type="text">
                <button>submit</button>
                </div>
            </form>
            <p id="loading"></p>
            <div class="container" id="results">
                
            </div>
            
        </div>
    </body>    
</html>

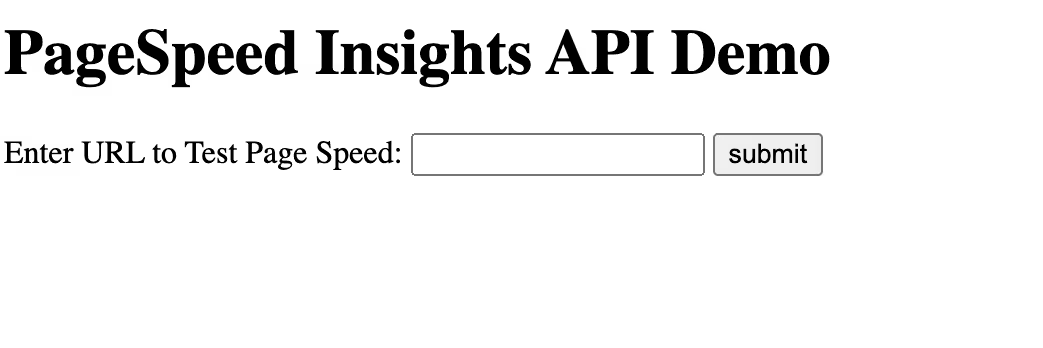
Open this file in a browser. This will give you a skeleton UI with a field for inputting the URL you want to analyze, a button to submit the request to the PageSpeed Insights API, and a blank loader. Additionally, in the code, there's a container <div> that you can use to display both the loader and the performance results of the API call. The button's onsubmit action is currently calling a getPageSpeedInsights() function, which you'll implement in the next step.

As you can see, the HTML web page is quite plain:

HTML web page

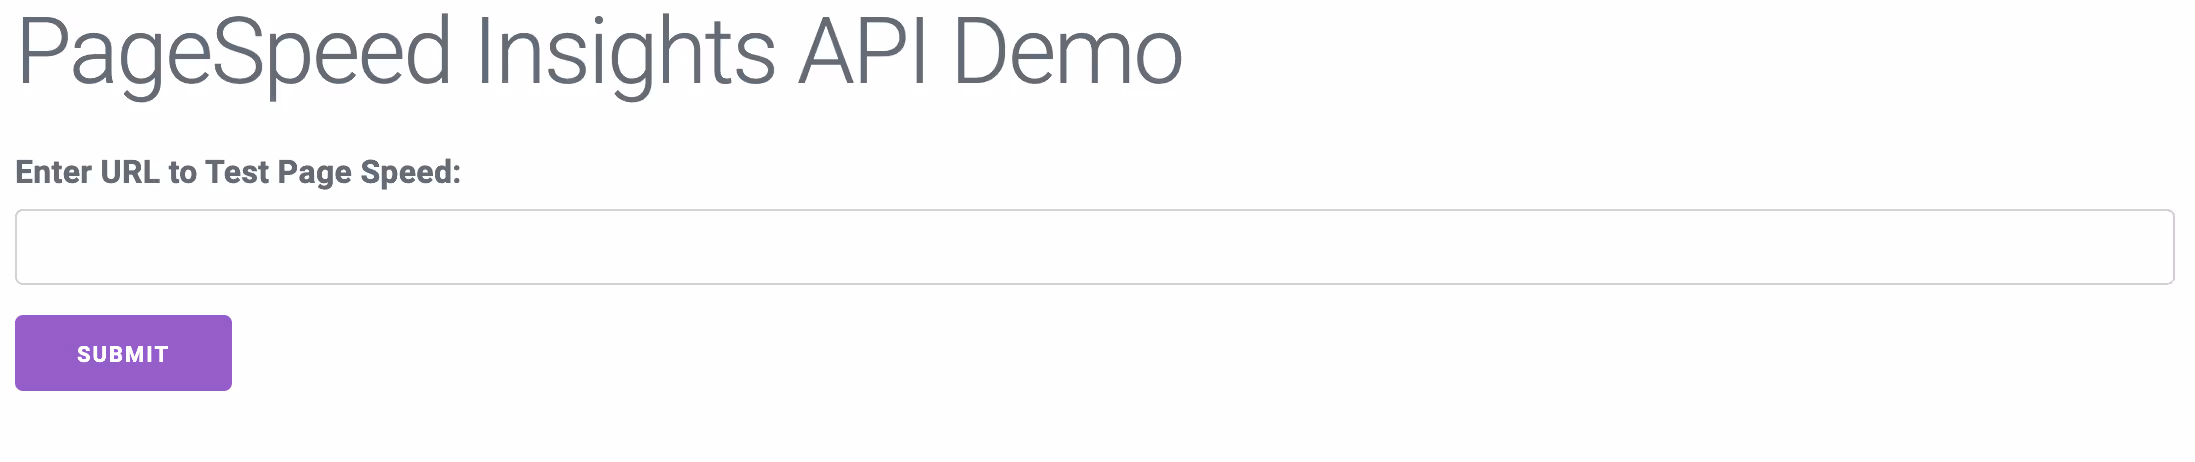
Before implementing the getPageSpeedInsights() function, you can improve the UI's look with a few simple changes, like adding a CDN link for milligram.css:


<html>
    <head>
        <span class="pln">
        </span><link rel="stylesheet" href="https://fonts.googleapis.com/css?family=Roboto:300,300italic,700,700italic"><span class="pln">
        </span><link rel="stylesheet" href="https://cdnjs.cloudflare.com/ajax/libs/normalize/8.0.1/normalize.css"><span class="pln">
        </span><link rel="stylesheet" href="https://cdnjs.cloudflare.com/ajax/libs/milligram/1.4.1/milligram.css"><span class="pln">
        </span>
    </head>
    <body>
        <div class="container" id="main">
            <h1>PageSpeed Insights API Demo</h1>
            <form onsubmit="return getPageSpeedInsights()">
                <div>
                <label>Enter URL to Test Page Speed:</label>
                <input id="url" name="url" type="text">
                <button>submit</button>
                </div>
            </form>
            <p id="loading"></p>
            <div class="container" id="results">
                
            </div>
        </div>
    </body>    
</html>

This helps make the UI a little bit more visually appealing:

UI with Milligram

Using the Fetch API to Get the Result from PageSpeed Insights

To get the data for your UI, use the fetch() method to make a request to the PageSpeed Insights API. The API will respond with the performance results from CrUX and Lighthouse. You can then feed these results into your UI.

Create a <script> tag in the HTML file you created above. Add the following code to implement the getPageSpeedInsights() function:


     const apiKey = ""
     function getPageSpeedInsights() {
        const inputURL = document.getElementById('url').value;
        document.getElementById('loading').innerHTML = "Please wait...Running the PageSpeed Insights..."
        document.getElementById("results").innerHTML = ""

        const url = buildQueryURL(inputURL, apiKey);
        fetch(url)
          .then(response => response.json())
          .then(displayResult);
        
        return false
    }

  function displayResult(json) {
      // The code will be added in the next step
   }

function buildQueryURL {
      const api = 'https://www.googleapis.com/pagespeedonline/v5/runPagespeed';
      let query = `${api}?url=${encodeURIComponent(url)}`;
      if(key != ""){
        query += `&key=${key}`
      }
      return query;
}

This code uses the Fetch API to make a `fetch` request to the PageSpeed v5 API. It adds the message `"Please wait...Running the PageSpeed Insights..."`  to the element with id `"loading"`  before running the API. This lets users know that the request is being made. The code includes a constant called `apiKey` that you can update with your API key. Your API key will then be appended to the request URL in the buildQueryURL function.

The result of the API request contains CrUX information, which can be extracted from the `loadingExperience` object of the response body. You can extract and display some of the attributes from the result. In this case, the  "First Contentful Paint" and "Cumulative Layout Shift Score" data from the response are used to populate the UI display. Similarly, you can also extract the performance result from Lighthouse using the `lighthouseResult` object from the same `fetch` request:


    // Replace with the API key
    const apiKey = ""

    function getPageSpeedInsights() {
        const inputURL = document.getElementById('url').value;
        document.getElementById('loading').innerHTML = "Please wait...Running the PageSpeed Insights..."
        document.getElementById("results").innerHTML = ""

        const url = buildQueryURL(inputURL, apiKey);
        fetch(url)
          .then(response => response.json())
          .then(displayResult);
        
        return false
    }

    function displayResult(json) {
      // Read the crux metrics
      const cruxMetrics = {
        "Cumulative Layout Shift Score": json.loadingExperience.metrics.CUMULATIVE_LAYOUT_SHIFT_SCORE.category,
        "First Contentful Paint": json.loadingExperience.metrics.FIRST_CONTENTFUL_PAINT_MS.category,
      };
      // Display the crux content
      showCruxContent(cruxMetrics);
      // Read the lighthouseResult metrics
      const lighthouse = json.lighthouseResult;
      const lighthouseMetrics = {
        'Timing': lighthouse.timing.total,
        'Total Blocking Time': lighthouse.audits['total-blocking-time'].displayValue,
        'First Contentful Paint': lighthouse.audits['first-contentful-paint'].displayValue,
        'Speed Index': lighthouse.audits['speed-index'].displayValue,
        'Time To Interactive': lighthouse.audits['interactive'].displayValue,
        'First Meaningful Paint': lighthouse.audits['first-meaningful-paint'].displayValue,
      };
      // Display the Lighthouse content
      showLighthouseContent(lighthouseMetrics);

      // Screenshot
      showFullPageScreenshot(lighthouse.fullPageScreenshot)
    }
  
    function buildQueryURL(url, key) {    
      const api = 'https://www.googleapis.com/pagespeedonline/v5/runPagespeed';
      let query = `${api}?url=${encodeURIComponent(url)}`;
      if(key != ""){
        query += `&key=${key}`
      }
      return query;
    }

    function showFullPageScreenshot(fullPageScreenshot) {
      const lighthouseHeader = document.createElement('h2');
      lighthouseHeader.textContent = "Screenshot";
      document.getElementById("results").appendChild(lighthouseHeader);
      var img = document.createElement('img');
      img.src = fullPageScreenshot.screenshot.data;
      document.getElementById("results").appendChild(img);
    }
    
    function showCruxContent(cruxMetrics) {
      document.getElementById("loading").innerHTML = ""
      const cruxHeader = document.createElement('h2');
      cruxHeader.textContent = "Chrome User Experience Report Results";
      document.getElementById("results").appendChild(cruxHeader);

      var c, r, t;
      t = document.createElement('table');
      r = t.insertRow(0);
      c = r.insertCell(0);
      c.innerHTML = "Metrics";
      c = r.insertCell(1);
      c.innerHTML = "Value";

      var counter = 1
      for (key in cruxMetrics) {
        r = t.insertRow(counter);
        c = r.insertCell(0);
        c.innerHTML = key;
        c = r.insertCell(1);
        c.innerHTML = cruxMetrics[key];
        counter++
      }
      document.getElementById("results").appendChild(t);
    }
    
    function showLighthouseContent(lighthouseMetrics) {
      document.getElementById("loading").innerHTML = ""
      const lighthouseHeader = document.createElement('h2');
      lighthouseHeader.textContent = "Lighthouse Results";
      document.getElementById("results").appendChild(lighthouseHeader);

      var c, r, t;
      t = document.createElement('table');
      r = t.insertRow(0);
      c = r.insertCell(0);
      c.innerHTML = "Metrics";
      c = r.insertCell(1);
      c.innerHTML = "Value";

      var counter = 1
      for (key in lighthouseMetrics) {
        r = t.insertRow(counter);
        c = r.insertCell(0);
        c.innerHTML = key;
        c = r.insertCell(1);
        c.innerHTML = lighthouseMetrics[key];
        counter++
      }
      document.getElementById("results").appendChild(t);
    }

The showCruxContent and showLighthouseContent functions use the data from cruxMetrics and lighthouseMetrics, respectively. These functions dynamically create a table using the createElement function. They then iterate over the metrics, and each metric is appended as a row in the table.

You can also use the fullPageScreenshot from the lighthouseResult object to display the full screenshot of the page being monitored. The function showFullPageScreenshot uses fullPageScreenshot.screenshot.data to get the image binary, and the img tag displays the image.

The tool is now complete and ready to use. Use the submit button to get the results, and the website's performance will be displayed in your browser:

Monitoring website performance

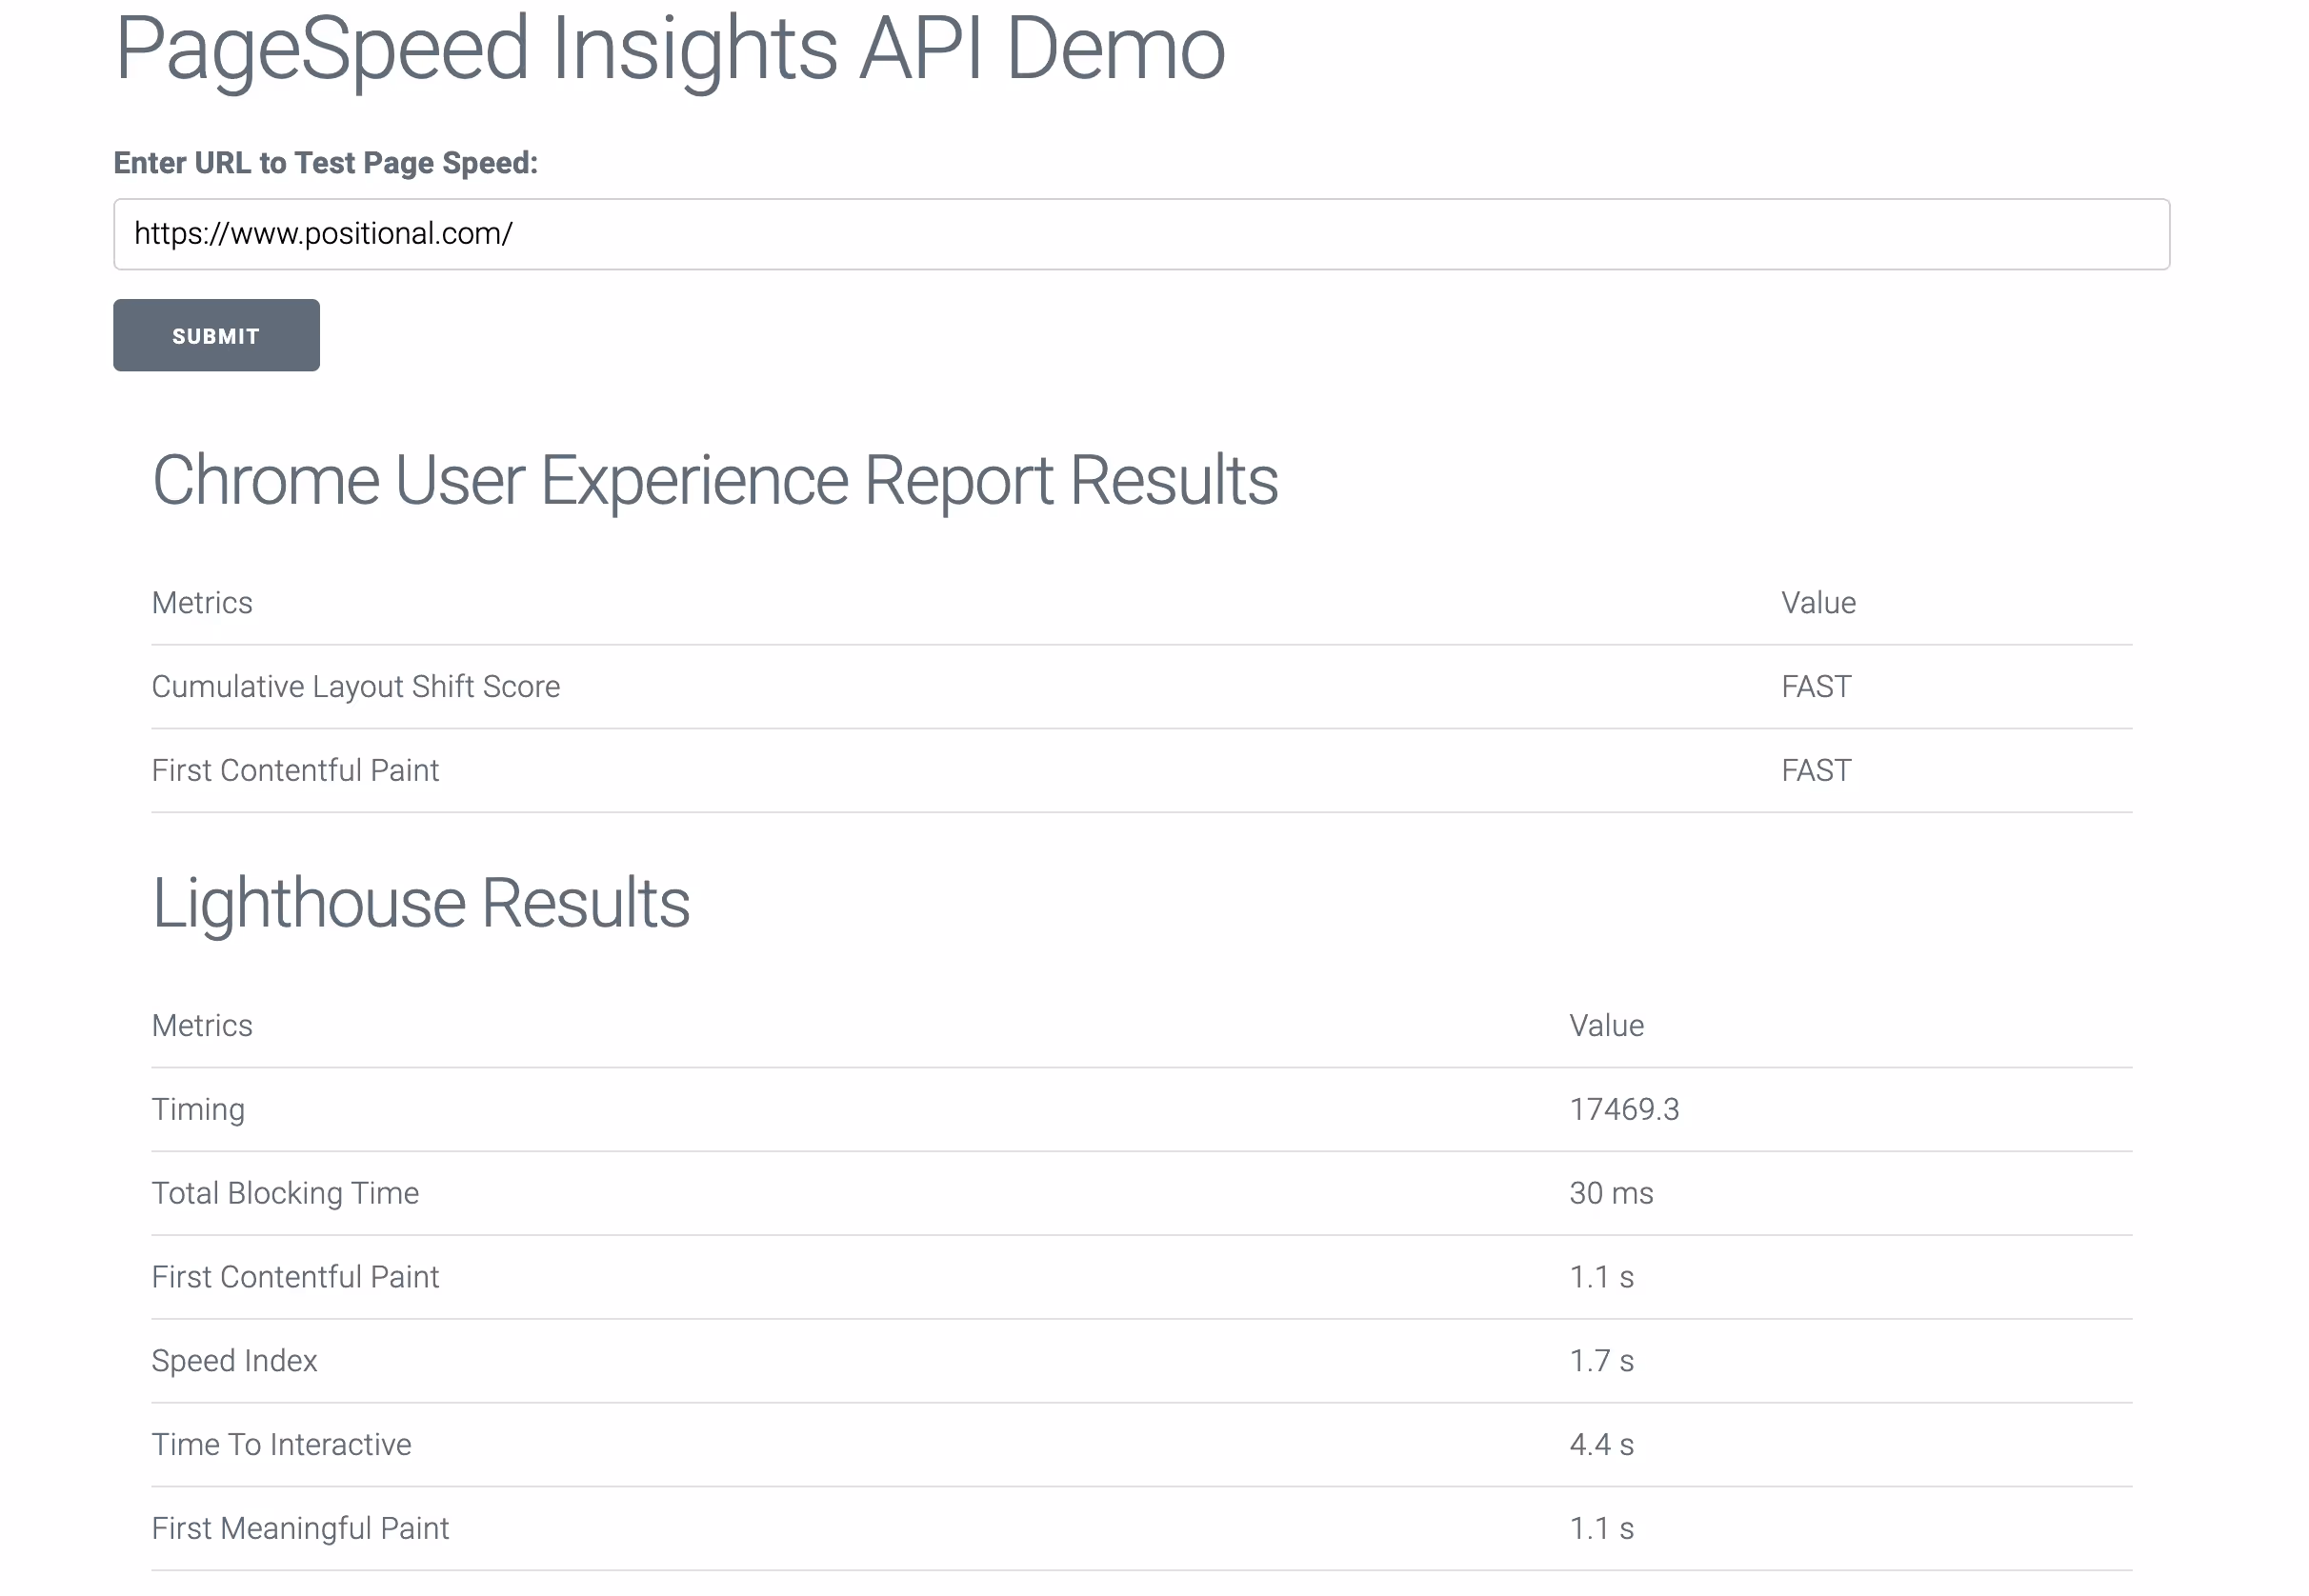
This example only uses a couple of performance data points from the API. The API can provide a wealth of additional data. Some other examples include estimated input latency, largest contentful paint, suggestions to optimize large images, screenshots of the page load, and much more. You can find more details about all the attributes you can get from the API in the PageSpeed API Reference.

The complete code used in this tutorial is in this GitHub repo.

Pros and Cons of the PageSpeed Insights API

The PageSpeed Insights API uses lab data from Lighthouse and real-world data from CrUX, which provides accurate and relevant data points for measuring your web page's performance. The API is simple and easy to use. Even without an access key, you can easily integrate the API if you only need a limited number of API requests.

However, PageSpeed is quite primitive, and the data can often be unreliable. For instance, running the same speed test at different times of day can give you different results. It uses simulated throttling that isn't reliable. There are a few other limitations to using the PageSpeed Insights API approach:

  • Developed tools need to be self-managed and maintained periodically.
  • PageSpeed Insights is regularly updated with new releases. So, it's important to stay up-to-date with the latest API version in order to ensure that your tool is running smoothly. This requirement means that regular updates to your tool are necessary, which can add to maintenance overhead.
  • You need to build dashboards from scratch. The API provides the data, but to visualize it, you need to build dashboards. Maintaining and developing a dashboard that visualizes the data and provides useful insights into performance issues can be challenging.
  • The PageSpeed Insights API quota can be limited if you need extensive access to the API. As mentioned, it has a limit of 25,000 queries per day or 400 queries per 100 seconds. You can request a higher quota if necessary, but it is not always possible to increase your quota.

Final Thoughts

The PageSpeed Insights API provides valuable data for measuring the performance of web pages, including suggestions for improving accessibility, SEO, and more. The API can be used to create custom reports and integrations with other tools. In particular, as part of your SEO strategy, the PageSpeed Insights API may be helpful for enriching internal tools with Core Web Vitals data.

In this article, you learned how to implement a simple internal tool for conducting web audits using the API, with step-by-step instructions for creating a UI and using the Fetch API to retrieve and display data.

At Positional, we are building tools for content marketing and SEO teams. We have a number of tools for everything from technical SEO to content optimization. If you have any additional questions about using the PageSpeed Insights API or the impact of Core Web Vitals on SEO, feel free to reach out to us as support@positional.com.

Milap Neupane
Software Engineer

Milap Neupane is a Senior Software Engineer at FORM3, where he works with Ruby/Rails, Golang, and cloud-native technologies with AWS. As part of his role, he is the organizer of Golang Kathmandu. He enjoys writing about highly technical topics, including content that helps growth marketing teams utilize APIs to improve website performance. Milap has a Bachelor of Science in Computer Science and Information Technology from Tribhuvan University in Nepal.

Read More

Looking to learn more? The below posts may be helpful for you to learn more about content marketing & SEO.